Fig. 8
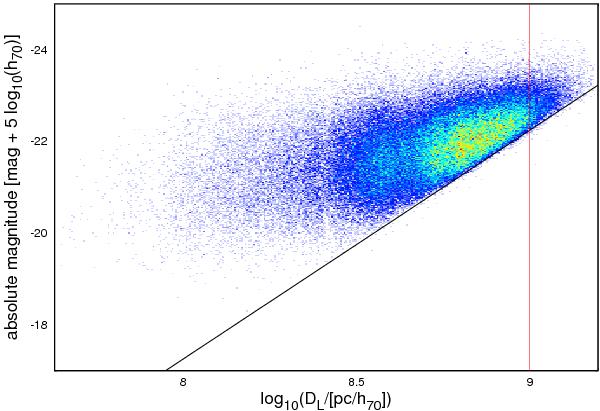
Malmquist bias affecting the magnitude-distance distribution of our sample. Taking the example of the r band for the dV model parameters, one can see a deviation of the pure Malmquist bias (indicated by the black solid line) at large distances. The red solid line indicates a distance corresponding to a redshift of 0.2, which is the limit of our selected sample.
Current usage metrics show cumulative count of Article Views (full-text article views including HTML views, PDF and ePub downloads, according to the available data) and Abstracts Views on Vision4Press platform.
Data correspond to usage on the plateform after 2015. The current usage metrics is available 48-96 hours after online publication and is updated daily on week days.
Initial download of the metrics may take a while.