Free Access
Fig. 2
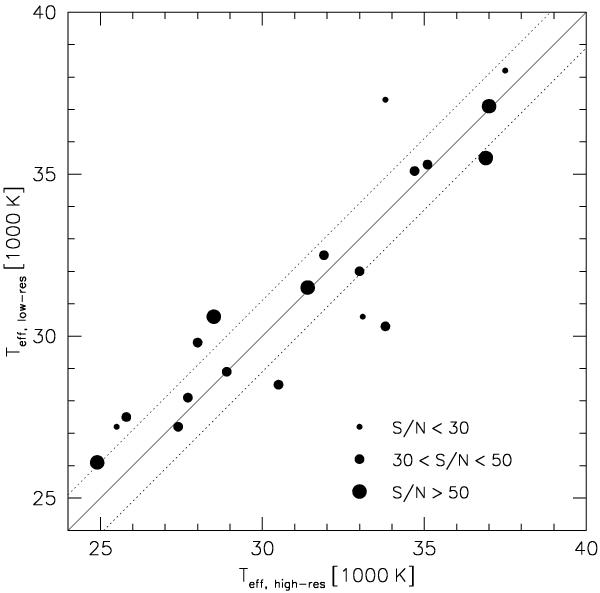
Effective temperature derived from high-resolution spectra plotted against effective temperature derived from medium resolution spectra (ISIS, SAAO-Reticon, CAFOS). The dotted lines mark the average deviation between the two datasets. The size of the points scales with the data quality of the high-resolution spectra.
Current usage metrics show cumulative count of Article Views (full-text article views including HTML views, PDF and ePub downloads, according to the available data) and Abstracts Views on Vision4Press platform.
Data correspond to usage on the plateform after 2015. The current usage metrics is available 48-96 hours after online publication and is updated daily on week days.
Initial download of the metrics may take a while.