Fig. 4
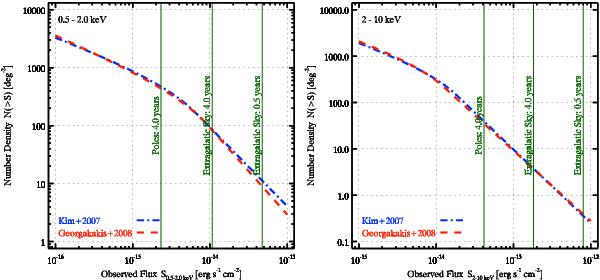
Cumulative number counts N(>S) for observed X-ray point-sources in the soft (left) and hard band (right). The blue dashed-dotted curve is from Kim et al. (2007, Table 3, ChaMP+CDFs) and the red dashed curve from Georgakakis et al. (2008). The vertical solid lines indicate the point-source detection sensitivity for different survey durations assuming 80% observing efficiency, and the sensitivity at the 20 ks exposure time, corresponding to the confusion limit in the soft band (left-most line marked “Poles”).
Current usage metrics show cumulative count of Article Views (full-text article views including HTML views, PDF and ePub downloads, according to the available data) and Abstracts Views on Vision4Press platform.
Data correspond to usage on the plateform after 2015. The current usage metrics is available 48-96 hours after online publication and is updated daily on week days.
Initial download of the metrics may take a while.