Fig. 8
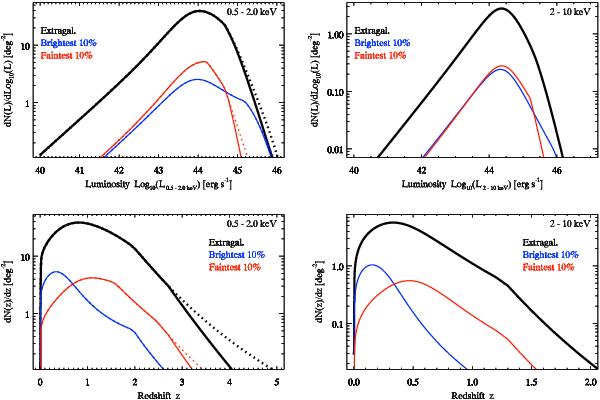
Differential luminosity (top) and redshift (bottom) distributions in the soft (left) and hard (right) bands for the entire extragalactic AGN sample after fours years (black) and for the brightest 10% (blue) and faintest 10% (red). The black curves are same as in Figs. 6 and 7, but without renormalization to unity.
Current usage metrics show cumulative count of Article Views (full-text article views including HTML views, PDF and ePub downloads, according to the available data) and Abstracts Views on Vision4Press platform.
Data correspond to usage on the plateform after 2015. The current usage metrics is available 48-96 hours after online publication and is updated daily on week days.
Initial download of the metrics may take a while.