Fig. 4
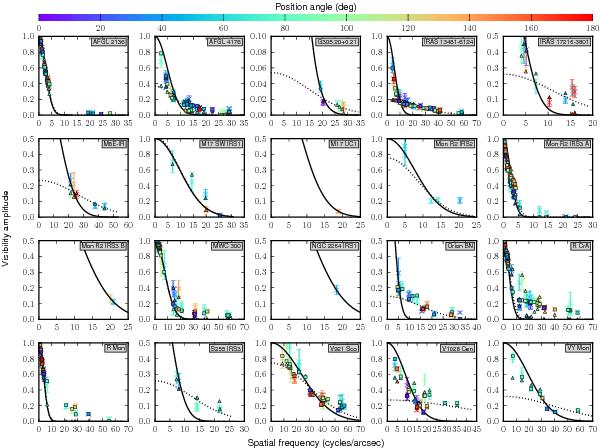
Best-fit geometric models to the 10.6 μm visibilities. The observations are shown as crosses with error bars; the color corresponds to the position angle of the measurement, shown in the color bar at the top of the plot. The 1D model is shown as a solid line, and the 1DOR model is shown as a dotted line. The triangles show the 2DOR model, while the squares show the 2D1D model. For a description of the different models, see Sect. 4.1.
Current usage metrics show cumulative count of Article Views (full-text article views including HTML views, PDF and ePub downloads, according to the available data) and Abstracts Views on Vision4Press platform.
Data correspond to usage on the plateform after 2015. The current usage metrics is available 48-96 hours after online publication and is updated daily on week days.
Initial download of the metrics may take a while.