Fig. 10
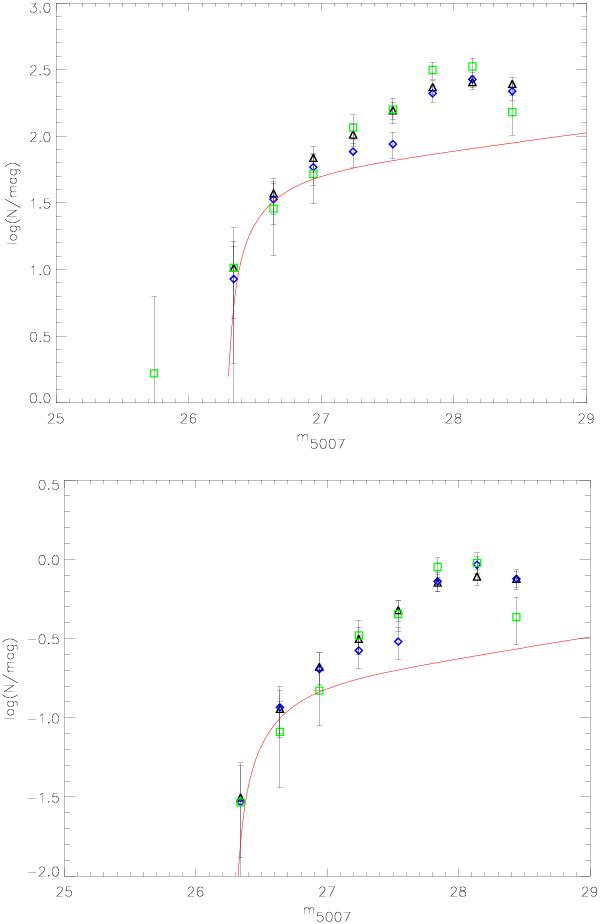
Top panel: empirical PNLFs in three radial ranges corrected for colour and detection incompleteness: PN candidates within 6.5′ from M 87 centre – triangles, PN candidates between 6.5′ and 13.5′ from M 87 centre – diamonds, PN candidates in the outermost region (distances greater than 13.5′) – squares.The respective Lyα contribution expected in each radial bin was subtracted. Magnitudes are binned in 0.3 mag bins and the error bars represent the 1σ uncertainty from counting statistics combined with the uncertainty from cosmic variance in the Lyα density (see text for details). As before, the red solid line is the convolved analytical formula of Ciardullo et al. (1989) for distance modulus 30.8. Lower panel: same as for the upper plot, but now the three PNLFs are normalised at the total number of objects in each radial bin. The three data sets are consistent with being drawn from the same underlying distribution.
Current usage metrics show cumulative count of Article Views (full-text article views including HTML views, PDF and ePub downloads, according to the available data) and Abstracts Views on Vision4Press platform.
Data correspond to usage on the plateform after 2015. The current usage metrics is available 48-96 hours after online publication and is updated daily on week days.
Initial download of the metrics may take a while.