Fig. 3
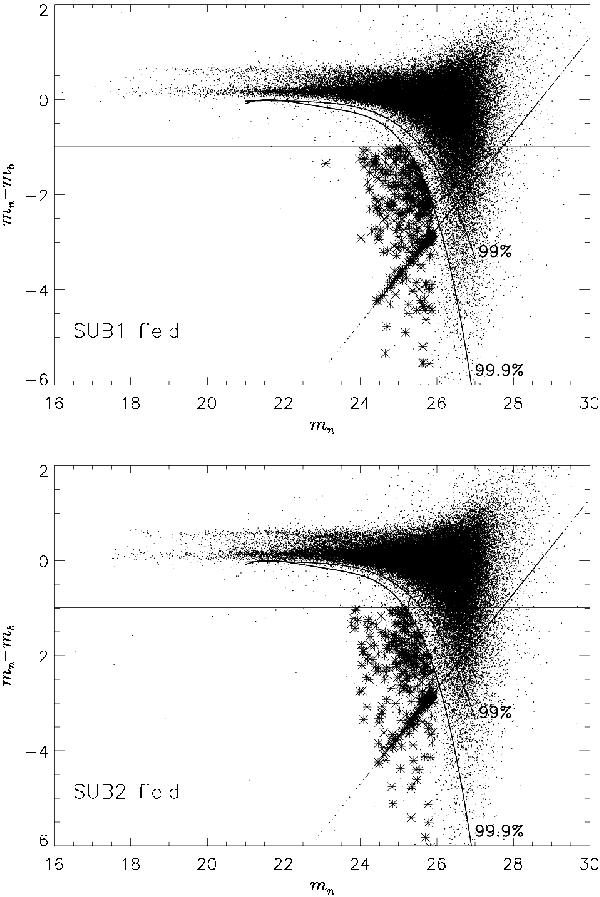
CMD for all sources in the M 87 SUB1 (top panel) and M 87 SUB2 (bottom panel) fields. The horizontal lines indicate the colour excess of emission line objects with an EWobs = 110 Å. The curved lines delimit the regions above which 99% and 99.9% of the simulated continuum objects fall in this diagram, given the photometric errors. The set of points on the inclined line represents those objects with no broadband magnitude measured by SExtractor (see Sect. 3.1 for more details). Asterisks represent objects classified as PNs according to the selection criteria discussed in Sect. 3.1.
Current usage metrics show cumulative count of Article Views (full-text article views including HTML views, PDF and ePub downloads, according to the available data) and Abstracts Views on Vision4Press platform.
Data correspond to usage on the plateform after 2015. The current usage metrics is available 48-96 hours after online publication and is updated daily on week days.
Initial download of the metrics may take a while.