Fig. 4
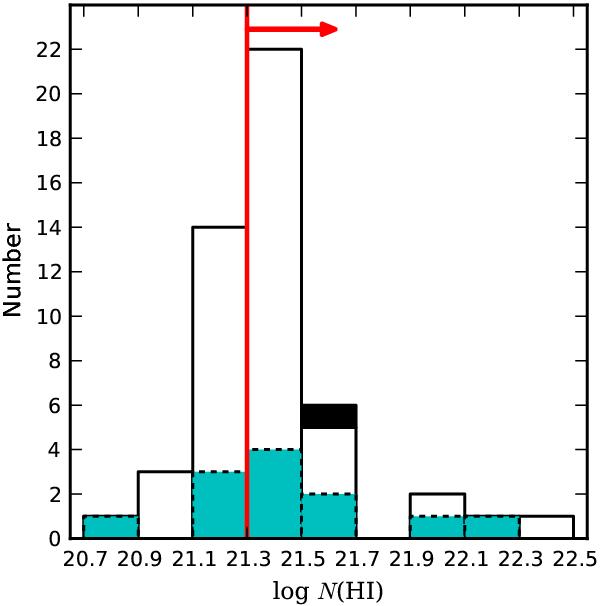
H i column density distribution for re-measured DR9 DLAs initially identified with log N(H i) ≥ 21.2 and Δv ≤ 3000 km s-1. Cyan shading indicates DLAs that reveal narrow Lyα emission. The sample is complete above log N(H i) = 21.3 (red arrow), and systems with lower column densities are not included in the statistical sample. One log N(H i) ≥ 21.3 DLA (marked with cross-hatching) is also not included in the statistical sample because of the velocity difference between the DLA and the quasar.
Current usage metrics show cumulative count of Article Views (full-text article views including HTML views, PDF and ePub downloads, according to the available data) and Abstracts Views on Vision4Press platform.
Data correspond to usage on the plateform after 2015. The current usage metrics is available 48-96 hours after online publication and is updated daily on week days.
Initial download of the metrics may take a while.