Fig. 6
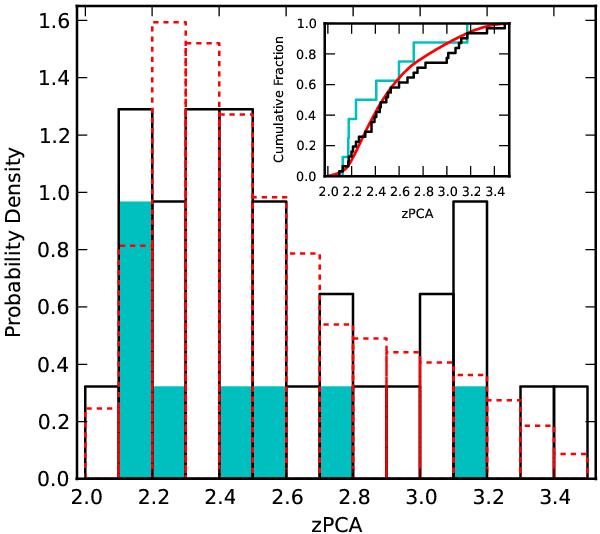
Distribution of quasar redshifts estimated from a principal component analysis for the statistical sample (solid black line) and the DR9 quasars (dashed red line). The relative portion of DLAs in the statistical sample that reveal narrow Lyα emission are shaded in cyan. The inset gives the cumulative fraction function using the same color scheme.
Current usage metrics show cumulative count of Article Views (full-text article views including HTML views, PDF and ePub downloads, according to the available data) and Abstracts Views on Vision4Press platform.
Data correspond to usage on the plateform after 2015. The current usage metrics is available 48-96 hours after online publication and is updated daily on week days.
Initial download of the metrics may take a while.