Fig. 8
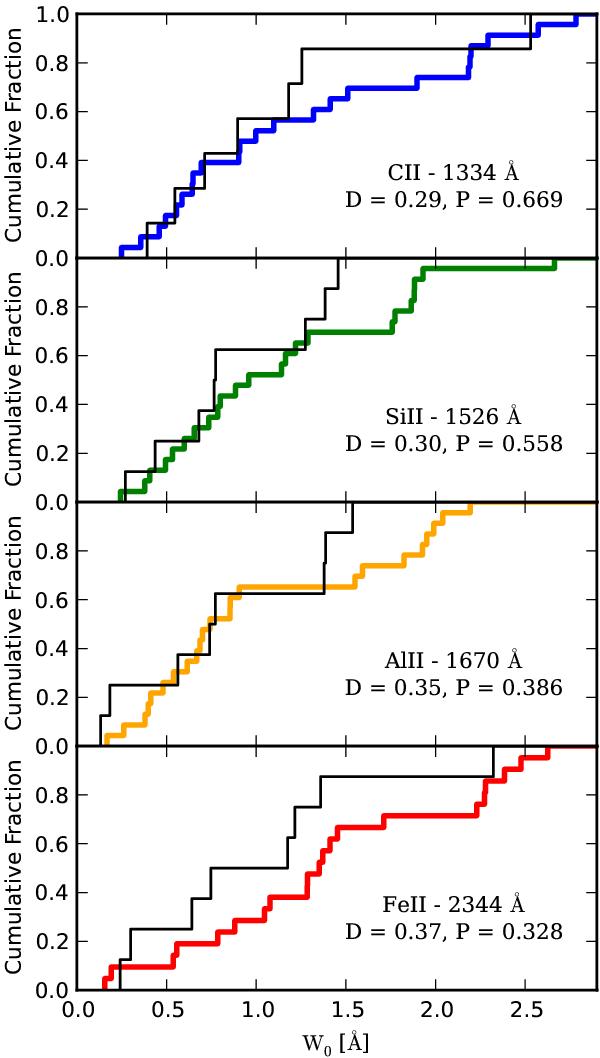
Kolmogorov-Smirnov tests comparing the DLAs with and without detected narrow Lyα emission using the rest equivalent widths for C ii – 1334 Å, Si ii – 1526 Å, Al ii – 1670 Å, and Fe ii – 2344 Å absorption features. A black line traces the W0 distribution for DLAs with narrow Lyα emission detected, and a thick colored line indicates the W0 distribution for those without an emission detection. The K-S test statistic, D, gives the maximum vertical distance between the two distributions, and the P-value is the probability that the two distributions are drawn from the same population.
Current usage metrics show cumulative count of Article Views (full-text article views including HTML views, PDF and ePub downloads, according to the available data) and Abstracts Views on Vision4Press platform.
Data correspond to usage on the plateform after 2015. The current usage metrics is available 48-96 hours after online publication and is updated daily on week days.
Initial download of the metrics may take a while.