Fig. 2
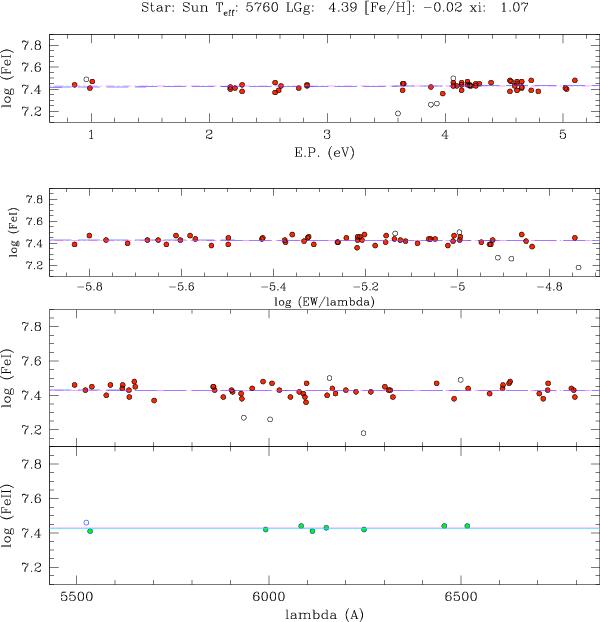
Example of the final control plot of FAMA. In the first three panels, the filled (red) circles are the abundances from the Fe i EWs accepted after the σ-clipping, while the empty circles are those rejected. In the first two panels the excitation and microturbulence equilibria are shown. The blue long-dashed line is the zero-slope curve, and the dashed magenta line is the slope of the final convergence point. In the third panel the dependence on iron abundances on λ is shown, and in the fourth panel, the ionization equilibrium is presented with the green circles being the Fe ii abundances used for gravity determination. The cyan horizontal line in the last panel is the average Fe ii abundance, while the magenta line is the average Fe i.
Current usage metrics show cumulative count of Article Views (full-text article views including HTML views, PDF and ePub downloads, according to the available data) and Abstracts Views on Vision4Press platform.
Data correspond to usage on the plateform after 2015. The current usage metrics is available 48-96 hours after online publication and is updated daily on week days.
Initial download of the metrics may take a while.