Fig. 3
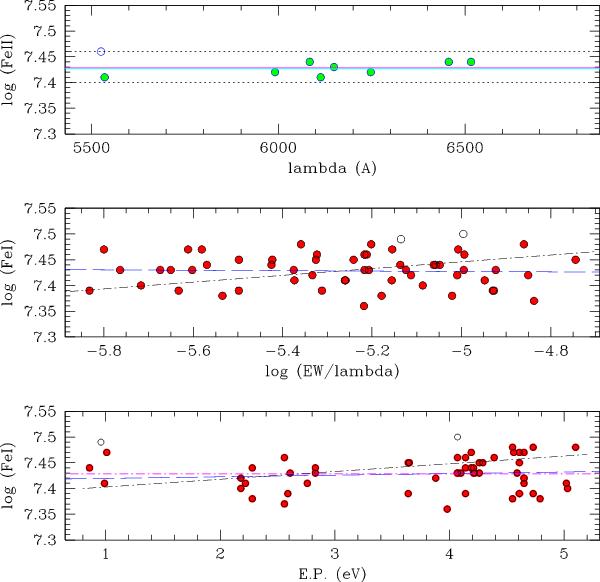
Evaluation of errors on the stellar parameters. The green circles are the lines accepted after the σ-clipping. The blue long-dashed line is the zero-slope curves, and the dashed magenta line is the slope of the final convergence point. The two dotted lines in the upper panel indicate  values. The dashed-dotted lines in the second and last panels show the lines with a slope of
  and of
  , respectively.
Current usage metrics show cumulative count of Article Views (full-text article views including HTML views, PDF and ePub downloads, according to the available data) and Abstracts Views on Vision4Press platform.
Data correspond to usage on the plateform after 2015. The current usage metrics is available 48-96 hours after online publication and is updated daily on week days.
Initial download of the metrics may take a while.