Fig. 17
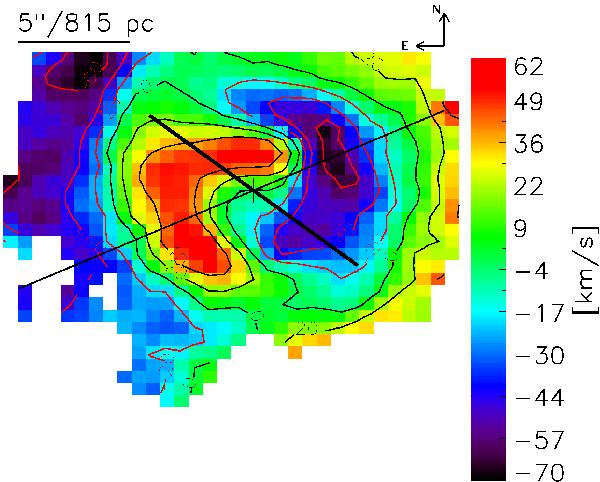
Differential LOSV map  . The major axis of the primary (thin line) and the secondary bar (thick line) are overplotted. The isovelocity contours are superimposed for 0, 20, and 40 km s-1 in black and for − 20, − 40, and − 60 km s-1 in red. The spatial extend of the KDC is given by its circular structure. Within the KDC, the underlying gas disk is counter-rotating with respect to the large scale gas distribution outside of the KDC.
Current usage metrics show cumulative count of Article Views (full-text article views including HTML views, PDF and ePub downloads, according to the available data) and Abstracts Views on Vision4Press platform.
Data correspond to usage on the plateform after 2015. The current usage metrics is available 48-96 hours after online publication and is updated daily on week days.
Initial download of the metrics may take a while.