Fig. 3
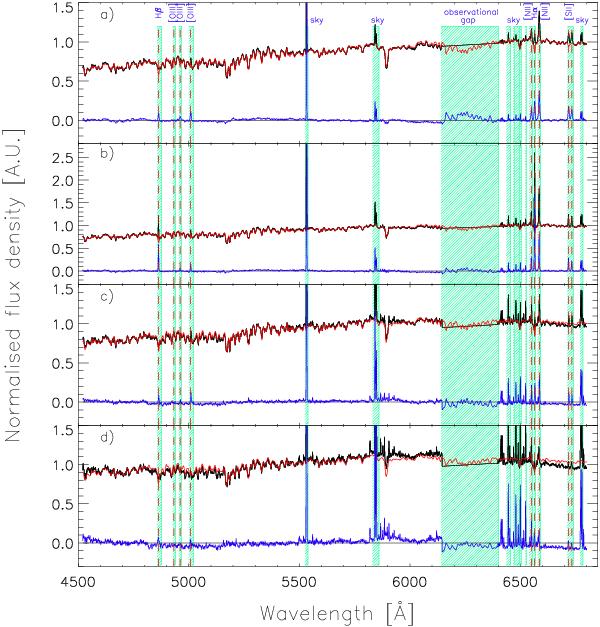
Spectra of different regions (given in arbitrary units; AU) within NGC 5850 before stellar subtraction (black) with overplotted stellar continuum fits by STARLIGHT (red) and residual spectrum (blue). The galaxy’s emission lines, the most prominent sky emission lines, and the observational gap between the blue and the red grating have been masked and are marked by the green colored boxes. The panels show the following regions: a) central pixel of NGC 5850; b) a star-formation region; c) a spectrum in a medium distance from the galaxy’s center (≈ 6″); and d) a spectrum extracted from a spaxel at the edge of the remaining FOV (ADEV >4%; see text for details).
Current usage metrics show cumulative count of Article Views (full-text article views including HTML views, PDF and ePub downloads, according to the available data) and Abstracts Views on Vision4Press platform.
Data correspond to usage on the plateform after 2015. The current usage metrics is available 48-96 hours after online publication and is updated daily on week days.
Initial download of the metrics may take a while.