Fig. 1
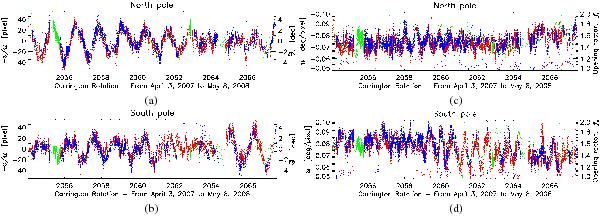
Time series of the intercept − v/u (a and b) and the slope parameter u (c and d) calculated for the north and south poles from data of EUVI A (in red), EUVI B (in blue), and EIT (in green) in the wavelength of 171 Å. The contributions of the different instruments are indicated by different colors. As explained in the text, the intercept is proportional to the projected heliographic colatitude  of the magnetic pole location. The slope is a measure of the projected opening factor fc of the polar magnetic field at the respective pole (see labeling of the respective right ordinate axes).
Current usage metrics show cumulative count of Article Views (full-text article views including HTML views, PDF and ePub downloads, according to the available data) and Abstracts Views on Vision4Press platform.
Data correspond to usage on the plateform after 2015. The current usage metrics is available 48-96 hours after online publication and is updated daily on week days.
Initial download of the metrics may take a while.