Fig. 2
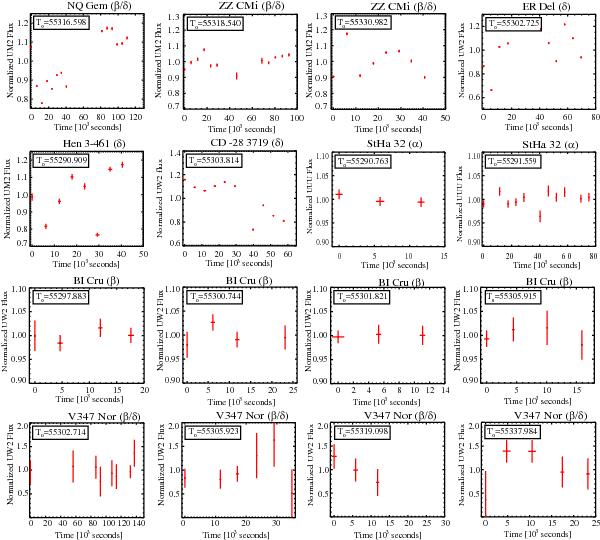
Swift UVOT light curves of X-ray detected sources (except for UV Aur that saturated the UVOT detector and SWIFT J171951.7-300206 that was only detectable after combining the individual exposures during each visit, see Sect. 3). We show the starting time of the observation, T0, in units of MJD. The x-axis has units of 103 seconds after T0. The values in the y-axis are the fluxes normalized by the average flux of the observation. Those visits with fewer than three exposures are not shown. On each panel, we also show the X-ray spectral types (see Sect. 5) proposed for each source.
Current usage metrics show cumulative count of Article Views (full-text article views including HTML views, PDF and ePub downloads, according to the available data) and Abstracts Views on Vision4Press platform.
Data correspond to usage on the plateform after 2015. The current usage metrics is available 48-96 hours after online publication and is updated daily on week days.
Initial download of the metrics may take a while.