Fig. 8
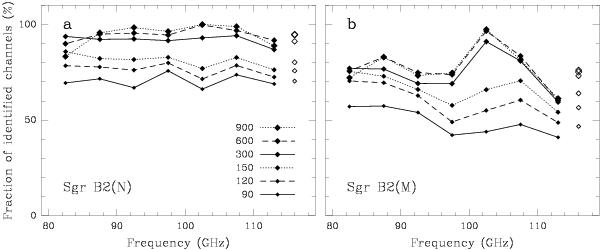
Fraction of identified channels in the spectra of a) Sgr B2(N) and b) Sgr B2(M) as a function of frequency. Each curve corresponds to a different temperature threshold, which is given in mK in the lower right corner of panel a). Each data point (filled diamond) corresponds to the average fraction of identified channels over a frequency range of 5 GHz, except for the point at highest frequency which is an average over 6 GHz. The unfilled diamonds to the right of each panel are the average fractions over the full frequency range 80 to 116 GHz, for the same temperature thresholds. The size of the filled and unfilled diamonds increases with the temperature threshold.
Current usage metrics show cumulative count of Article Views (full-text article views including HTML views, PDF and ePub downloads, according to the available data) and Abstracts Views on Vision4Press platform.
Data correspond to usage on the plateform after 2015. The current usage metrics is available 48-96 hours after online publication and is updated daily on week days.
Initial download of the metrics may take a while.