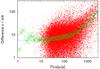
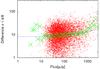
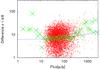
Fig. 6
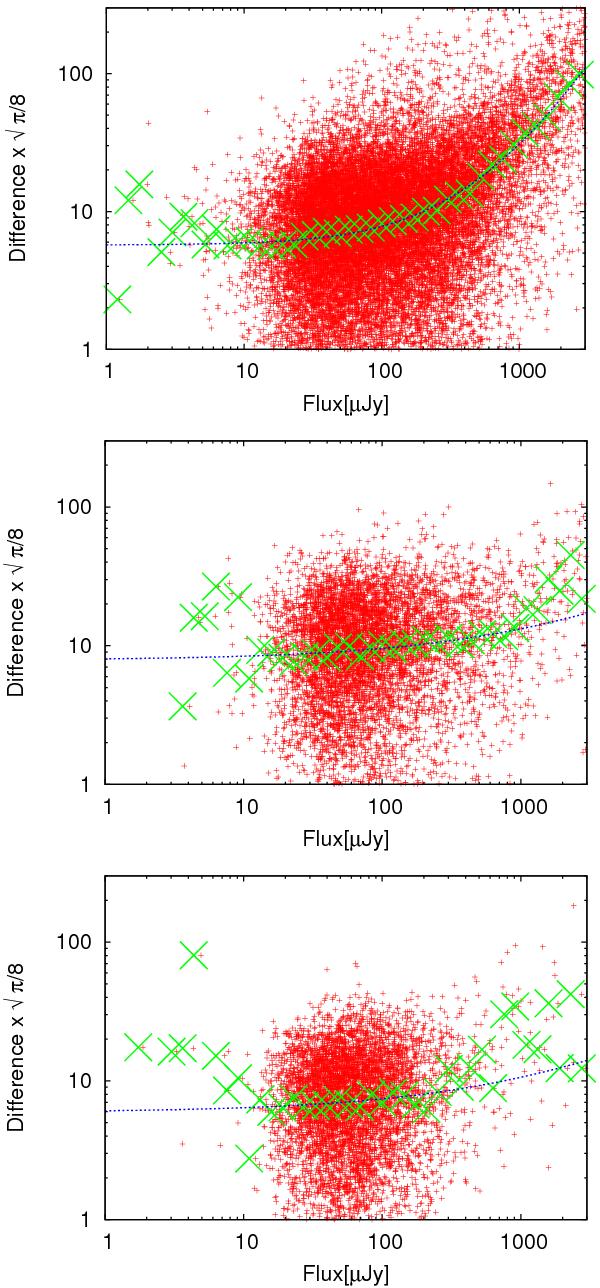
Flux errors are estimated from the difference between the fluxes from the A and the B images. In the top, middle, and bottom panels, flux errors in N3, S9W, and L15 are shown. Red points indicate the difference multiplied by  . Green crosses indicate the median value in a log flux bin size of 0.08. The blue dotted line shows the fitting result. The higher value of the red point and the line was adopted as the flux error.
Current usage metrics show cumulative count of Article Views (full-text article views including HTML views, PDF and ePub downloads, according to the available data) and Abstracts Views on Vision4Press platform.
Data correspond to usage on the plateform after 2015. The current usage metrics is available 48-96 hours after online publication and is updated daily on week days.
Initial download of the metrics may take a while.