Fig. 1
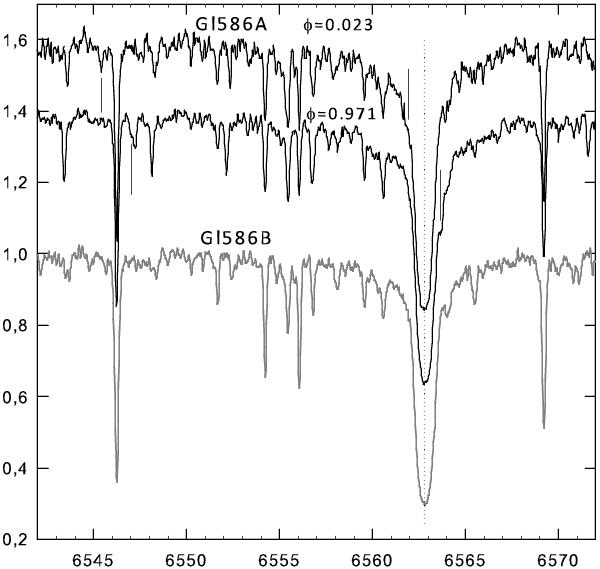
Example spectra of Gl586A and Gl586B for the wavelength region around Balmer Hα. The top two spectra are the A components shortly before (phase φ = 0.971) and after (phase φ = 0.023) periastron. The wavelength position of the weak Ab component is indicated with dash marks for Fe i 6546 and for Hα . The bottom spectrum in gray scale is the visual Gl586B component.
Current usage metrics show cumulative count of Article Views (full-text article views including HTML views, PDF and ePub downloads, according to the available data) and Abstracts Views on Vision4Press platform.
Data correspond to usage on the plateform after 2015. The current usage metrics is available 48-96 hours after online publication and is updated daily on week days.
Initial download of the metrics may take a while.