Fig. 2
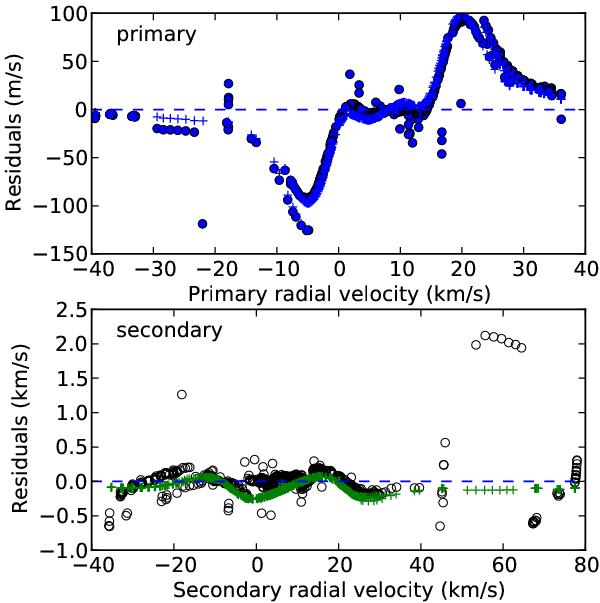
Systematic errors expected from artificial velocities for Gl586Aa (top panel) and Gl586Ab (bottom panel). A combined synthetic spectrum was computed for the time of every observed spectrum and radial velocities measured the same way as for the real observations. Pluses denote the synthetic velocities, circles are for the observed velocities.
Current usage metrics show cumulative count of Article Views (full-text article views including HTML views, PDF and ePub downloads, according to the available data) and Abstracts Views on Vision4Press platform.
Data correspond to usage on the plateform after 2015. The current usage metrics is available 48-96 hours after online publication and is updated daily on week days.
Initial download of the metrics may take a while.