Fig. 1
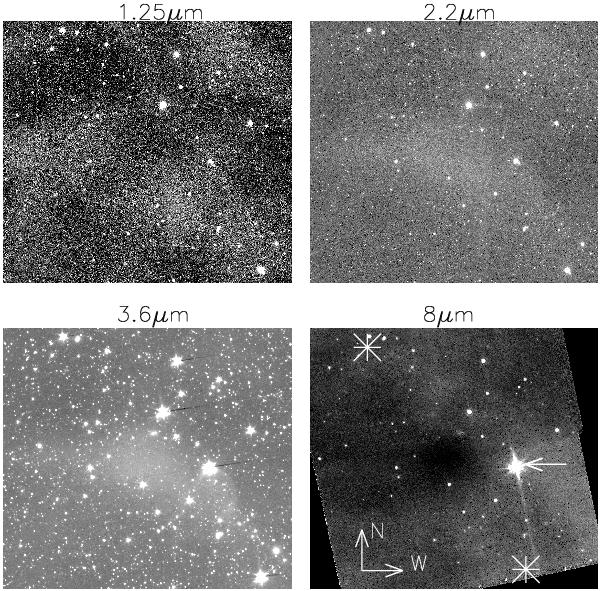
Top to bottom from left to right: the J, Ks, IRAC1, and IRAC4 images of L260. The maps are centred on (RA, Dec) = (16:47:08.35, –09:35:13) and the figures are in equatorial coordinates. Marked in IRAC4 with two asterisks is the extent of the cuts shown in Fig. 2 and the arrow indicates the location of the protostar. The field of view of each image is 108 × 98.
Current usage metrics show cumulative count of Article Views (full-text article views including HTML views, PDF and ePub downloads, according to the available data) and Abstracts Views on Vision4Press platform.
Data correspond to usage on the plateform after 2015. The current usage metrics is available 48-96 hours after online publication and is updated daily on week days.
Initial download of the metrics may take a while.