Free Access
Fig. 2
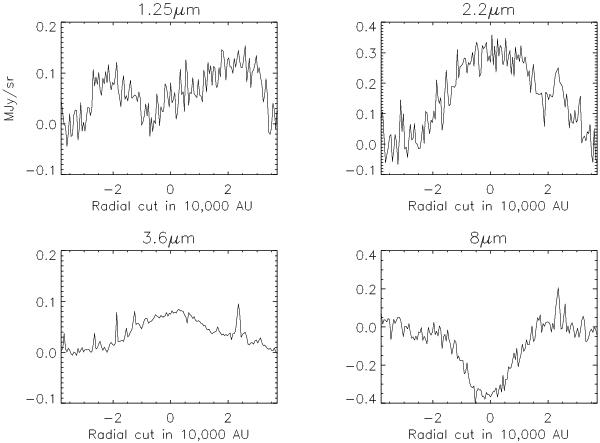
Surface brightness cuts through the core L260. The location of the cut is shown in panel 4 in Fig. 1. The cuts extend along constant Galactic latitude from the right hand side in Figure 1 towards the left between the points marked with asterisks. The bright spikes most notable in the IRAC1 profile are due to stars.
Current usage metrics show cumulative count of Article Views (full-text article views including HTML views, PDF and ePub downloads, according to the available data) and Abstracts Views on Vision4Press platform.
Data correspond to usage on the plateform after 2015. The current usage metrics is available 48-96 hours after online publication and is updated daily on week days.
Initial download of the metrics may take a while.