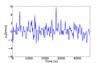
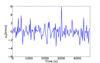
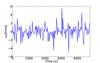
Fig. 3
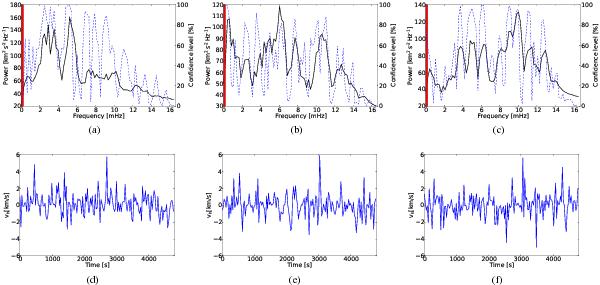
Upper panels: three examples of power spectral densities (continuous line) associated with three typical magnetic elements chosen from those that are the longest lived. The dashed line represents the confidence level obtained through a randomization test (see right-hand axis of the same plots). The red area represents the frequency resolution imposed by the duration of the associated time series. Bottom panels: horizontal velocity relative to the power spectra shown.
Current usage metrics show cumulative count of Article Views (full-text article views including HTML views, PDF and ePub downloads, according to the available data) and Abstracts Views on Vision4Press platform.
Data correspond to usage on the plateform after 2015. The current usage metrics is available 48-96 hours after online publication and is updated daily on week days.
Initial download of the metrics may take a while.