Fig. 1
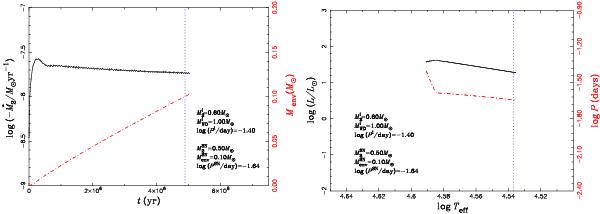
A representative example of binary evolution calculations. Left panel: the solid and dash-dotted curves show the mass-transfer rate and the mass of the helium layer on the WD varying with time after the helium star fills its Roche lobe, respectively. Right panel: the evolutionary track of the donor star is shown as a solid curve and the evolution of orbital period is shown as a dash-dotted curve. Dotted vertical lines in both panels indicate the position where the double detonation may happen. The initial binary parameters and the parameters at the moment of the SN explosion are given in these two panels.
Current usage metrics show cumulative count of Article Views (full-text article views including HTML views, PDF and ePub downloads, according to the available data) and Abstracts Views on Vision4Press platform.
Data correspond to usage on the plateform after 2015. The current usage metrics is available 48-96 hours after online publication and is updated daily on week days.
Initial download of the metrics may take a while.