Fig. 2
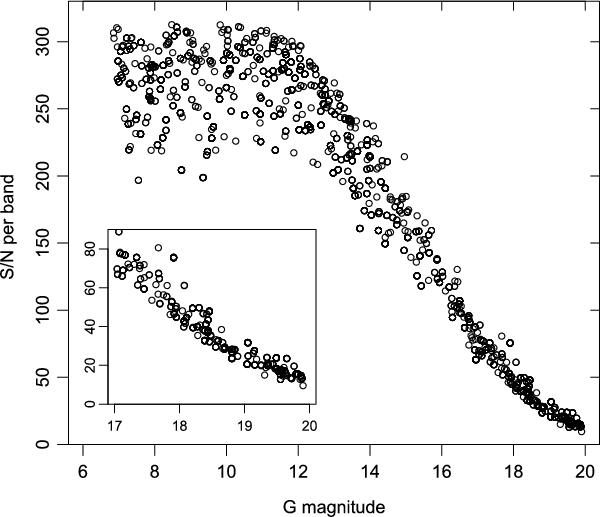
Variation of the S/N per band in end-of-mission BP/RP for a set of 2000 stars covering the HR diagram. The inset is a zoom of the fainter magnitudes. Discontinuities occur at several brighter magnitudes (barely visible here) on account of the use of TDI gates to limit the integration time for bright stars in order to avoid saturation of the CCDs. The S/N for each spectrum is the mean over the bands plotted in Fig. 1. In addition to the formal noise model errors, an additional error of 0.3% in the flux has been added in quadrature to accommodate calibration errors.
Current usage metrics show cumulative count of Article Views (full-text article views including HTML views, PDF and ePub downloads, according to the available data) and Abstracts Views on Vision4Press platform.
Data correspond to usage on the plateform after 2015. The current usage metrics is available 48-96 hours after online publication and is updated daily on week days.
Initial download of the metrics may take a while.