Fig. 3
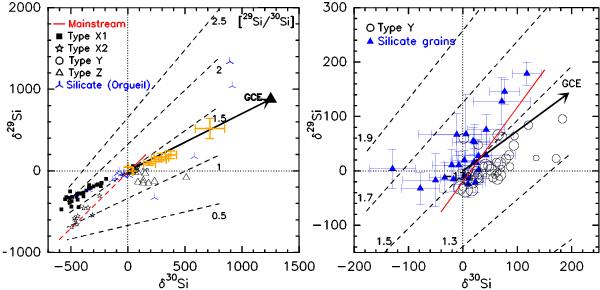
Silicon three-isotope plot for presolar grains. The delta notation is defined as δiSi/28Si = [(iSi/28Si)/(iSi/28Si)⊙ − 1] × 1000. The δ29Si/δ30Si ratios do not translate directly into the 29Si/30Si ratios, which are plotted as black dashed lines. Left: the data of different subgroups (X, Y, and Z) of SiC grains were taken from Lin et al. (2002), Amari et al. (2001), and Hoppe et al. (1997), and the Orgueil silicate grains from Zinner & Jadhav (2013). The mainstream type (~93%) of grains are indicated as a solid red line with a slope of 1.37. The dashed red line indicates the possible extension from the mainstream grains to X2 grains. The filled triangle indicates the ISM value (Wolff 1980), and the black arrow indicates the direction of the Galactic chemical evolution. The orange crosses are the evolved star sample (about 3 M⊙) from Tsuji et al. (1994). Right: similar plot as the left one, but on a smaller scale, and the different silicate grain data were taken from Nguyen et al. (2007), Mostefaoui & Hoppe (2004), and Nagashima et al. (2004).
Current usage metrics show cumulative count of Article Views (full-text article views including HTML views, PDF and ePub downloads, according to the available data) and Abstracts Views on Vision4Press platform.
Data correspond to usage on the plateform after 2015. The current usage metrics is available 48-96 hours after online publication and is updated daily on week days.
Initial download of the metrics may take a while.