Fig. 1
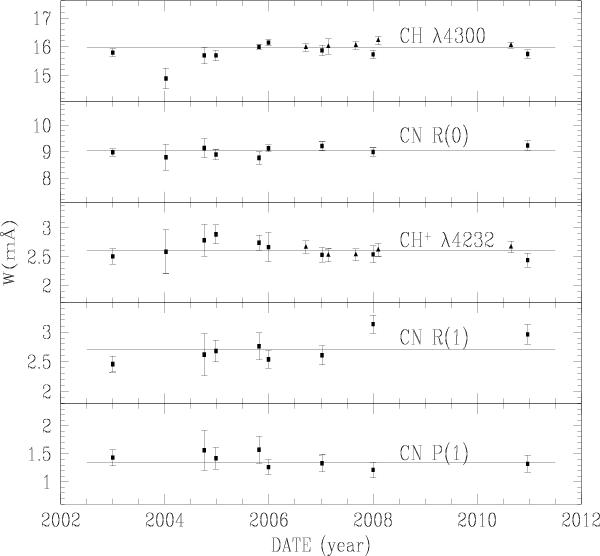
Equivalent width of (from top to bottom) the CH λ4300, CN (0,0) R(0), CH+λ4232, CN R(1), and P(1) lines in ζ Per spectra between 2003 and 2011 (filled squares correspond to McD data and filled triangles to OHP data; error bars correspond to ± 1σ uncertainties). For each absorption feature, the horizontal line indicates the weighted average computed over all W values.
Current usage metrics show cumulative count of Article Views (full-text article views including HTML views, PDF and ePub downloads, according to the available data) and Abstracts Views on Vision4Press platform.
Data correspond to usage on the plateform after 2015. The current usage metrics is available 48-96 hours after online publication and is updated daily on week days.
Initial download of the metrics may take a while.