Fig. 3
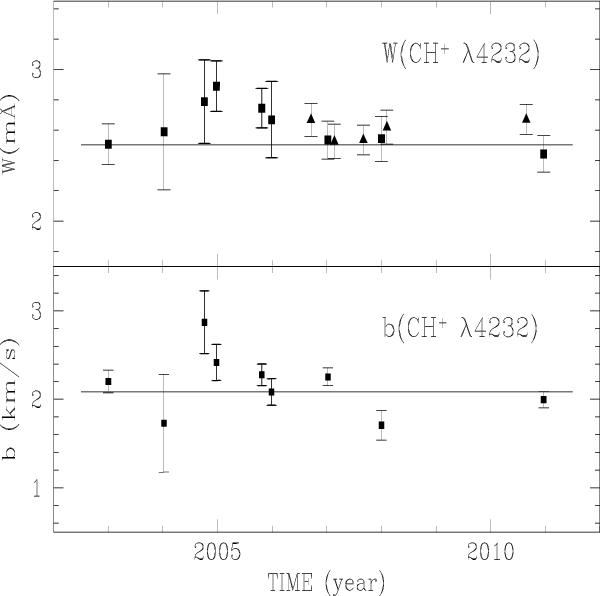
Equivalent width of the CH+λ4232 line (upper panel) in ζ Per spectra between 2003 and 2011 (same symbols as in Fig. 1) together with the corresponding b value measured from high resolution McD data (lower panel). Thick error bars indicate measurements used to assess the significance of a maximum in W and b around (“in” values; see text). The b values have been corrected for instrumental broadening (see text). Note that both W and b display a maximum around 2005. In each panel, the horizontal line indicates the weighted average computed outside the time interval over which W was larger.
Current usage metrics show cumulative count of Article Views (full-text article views including HTML views, PDF and ePub downloads, according to the available data) and Abstracts Views on Vision4Press platform.
Data correspond to usage on the plateform after 2015. The current usage metrics is available 48-96 hours after online publication and is updated daily on week days.
Initial download of the metrics may take a while.