Fig. 4
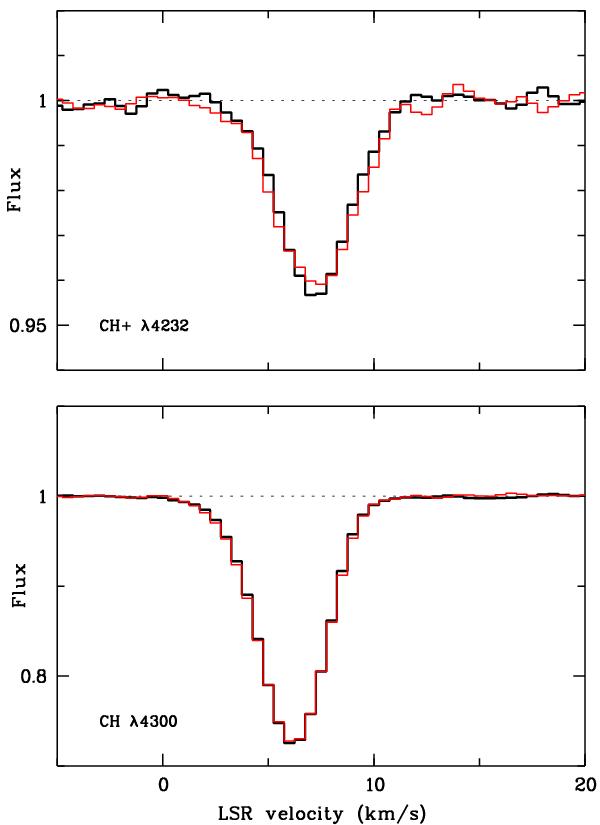
CH+ (upper panel) and CH (lower panel) average normalized line profiles computed in the 2004−2007 interval during which W(CH+) reached a maximum (red) and outside this interval (black). The CH+ profile was slightly broader in the 2004−2007 interval, which accounts for higher W values. Note the excellent match of the two CH profiles.
Current usage metrics show cumulative count of Article Views (full-text article views including HTML views, PDF and ePub downloads, according to the available data) and Abstracts Views on Vision4Press platform.
Data correspond to usage on the plateform after 2015. The current usage metrics is available 48-96 hours after online publication and is updated daily on week days.
Initial download of the metrics may take a while.