Fig. 10
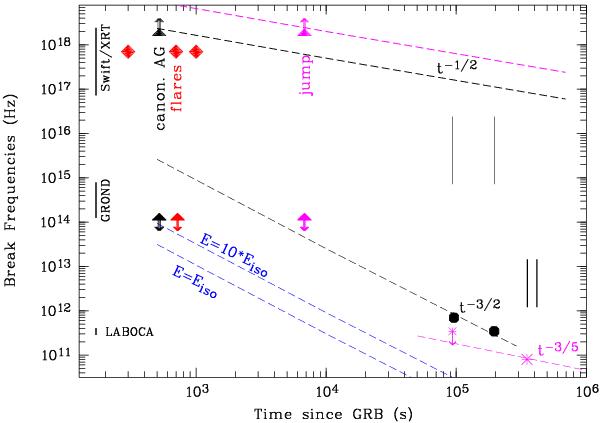
Location of the two breaks νc (top end) and νm (bottom part) at different epochs in the late-time evolution of the afterglow of GRB 100621A, for each of the three emission components (i) canonical afterglow (black); (ii) flares (red); and (iii) jump component (pink). Vertical bars indicate allowed ranges for νc or νm. The wavelength coverage of our instruments is shown as vertical bars at the very left side. Dashed lines show the expected evolution according to the standard fireball scenario after obeying the limits derived from our observations at various epochs.
Current usage metrics show cumulative count of Article Views (full-text article views including HTML views, PDF and ePub downloads, according to the available data) and Abstracts Views on Vision4Press platform.
Data correspond to usage on the plateform after 2015. The current usage metrics is available 48-96 hours after online publication and is updated daily on week days.
Initial download of the metrics may take a while.