Fig. 2
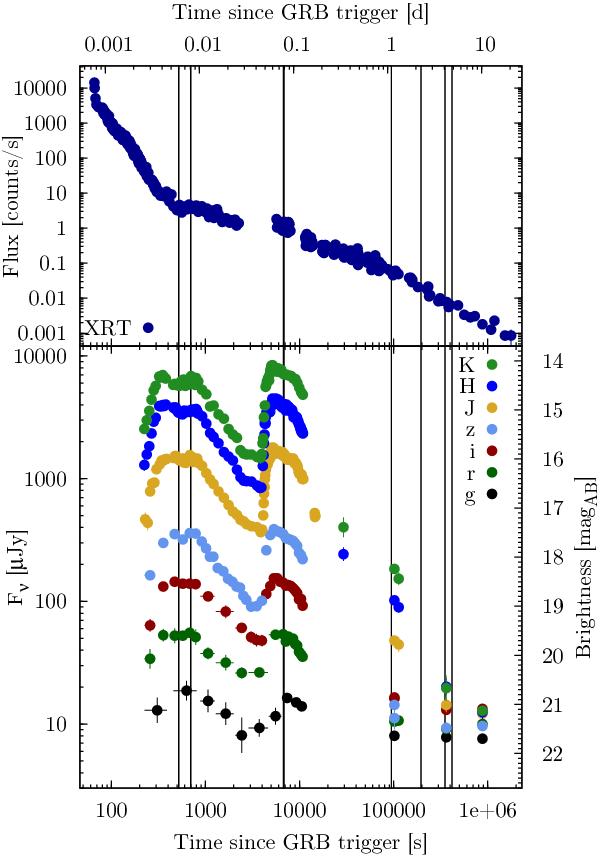
Afterglow light curve of GRB 100621A as observed with Swift in X-rays (top) and GROND in its seven filter bands (bottom). The J-band data points at 14 ks are from SOFI imaging, and the HKs-band data at 20 ks from a GROND observation in morning twilight at which the J-band was already saturated by the rising Sun. The seven vertical lines mark the times at which spectral energy distributions have been extracted (see text and Fig. 3).
Current usage metrics show cumulative count of Article Views (full-text article views including HTML views, PDF and ePub downloads, according to the available data) and Abstracts Views on Vision4Press platform.
Data correspond to usage on the plateform after 2015. The current usage metrics is available 48-96 hours after online publication and is updated daily on week days.
Initial download of the metrics may take a while.