Fig. 4
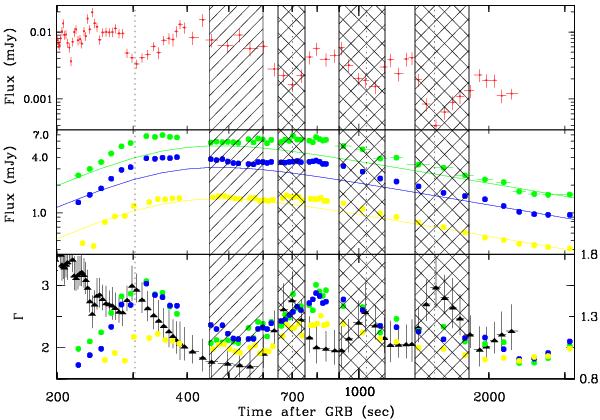
(Top panel) Comparison of the fluxed X-ray light curve at 10 keV; (middle panel) the GROND J (yellow), H (blue), Ks (green) bands; (bottom panel) the photon index of the X-ray spectrum (black, left y-axis scale) and the residuals of the model fit (see text) to the GROND JHK data (colour as in the middle panel, right y-axis scale). The diagonal-hatched region denotes epoch 1, the cross-hatched regions epoch 2. The dashed vertical lines mark the maxima in the photon spectral index Γ (Γ = β + 1) to guide the eyes.
Current usage metrics show cumulative count of Article Views (full-text article views including HTML views, PDF and ePub downloads, according to the available data) and Abstracts Views on Vision4Press platform.
Data correspond to usage on the plateform after 2015. The current usage metrics is available 48-96 hours after online publication and is updated daily on week days.
Initial download of the metrics may take a while.