Fig. 5
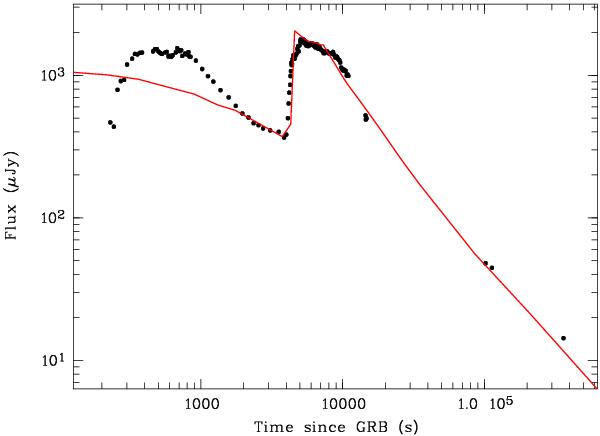
Early part of the GROND J-band light curve with a (slightly stretched in time) model of the two-shell collisions overplotted (case 4, Fig. 7 in Vlasis et al. 2011). Though this model was not aimed at reproducing the behaviour of the GRB 100621A afterglow, the similarity of the rise, structure at the peak, and the decay slope is striking. The early part of the model should be ignored, as it depends on the relative timing of the forward shock of the first shell, the ISM density, and the initial Lorentz factor.
Current usage metrics show cumulative count of Article Views (full-text article views including HTML views, PDF and ePub downloads, according to the available data) and Abstracts Views on Vision4Press platform.
Data correspond to usage on the plateform after 2015. The current usage metrics is available 48-96 hours after online publication and is updated daily on week days.
Initial download of the metrics may take a while.