Fig. 7
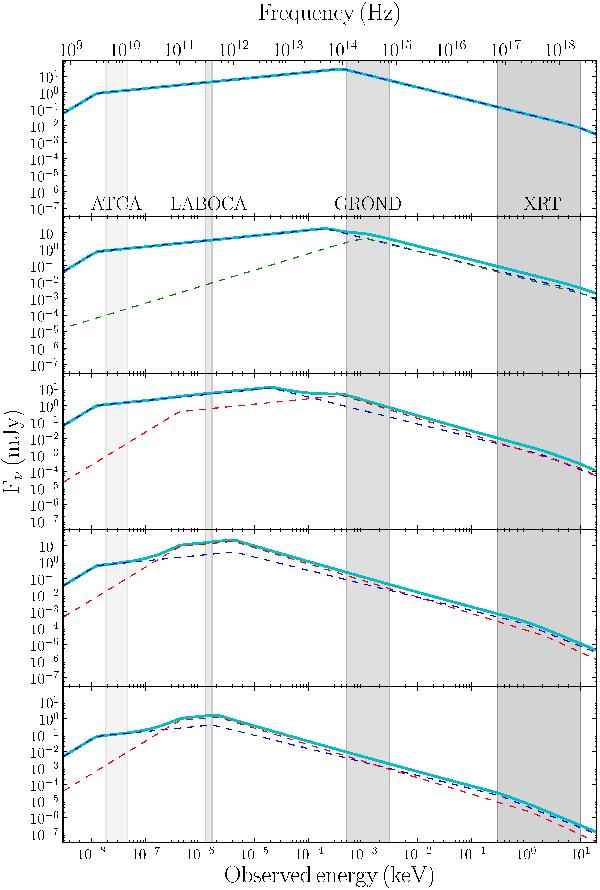
Visualization of the spectral energy distributions at the five epochs as discussed in the text, with panel 1 to 3 showing epochs 1−3, panel 4 showing epochs 4 and 5, and panel 5 showing epochs 6 and 7. The frequency/energy ranges covered by our observations are marked as shaded bands. Dashed lines mark the different emission components: afterglow (blue), flares (green), jump component (red). The thick line is the sum of these components.
Current usage metrics show cumulative count of Article Views (full-text article views including HTML views, PDF and ePub downloads, according to the available data) and Abstracts Views on Vision4Press platform.
Data correspond to usage on the plateform after 2015. The current usage metrics is available 48-96 hours after online publication and is updated daily on week days.
Initial download of the metrics may take a while.