Free Access
Fig. 16
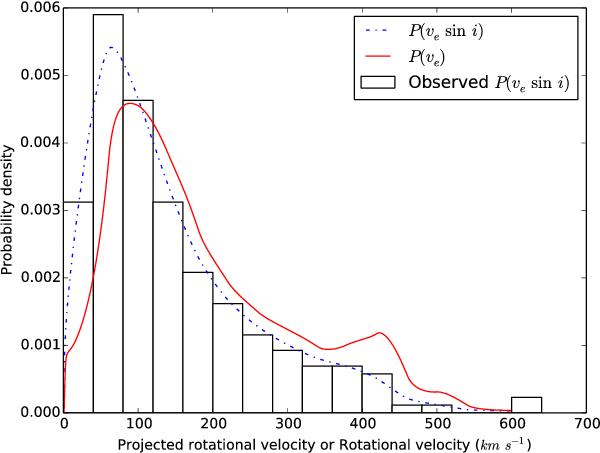
Observed νesini and Lucy-deconvolved νe distributions. The dot-dashed line shows the estimates, after 4 iterations in the Lucy-deconvolution, of the probability density function for the projected rotational velocity distribution. The solid line shows the probability density function of the actual rotational velocities.
Current usage metrics show cumulative count of Article Views (full-text article views including HTML views, PDF and ePub downloads, according to the available data) and Abstracts Views on Vision4Press platform.
Data correspond to usage on the plateform after 2015. The current usage metrics is available 48-96 hours after online publication and is updated daily on week days.
Initial download of the metrics may take a while.