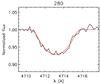
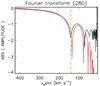
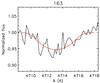
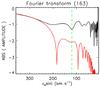
Fig. 5
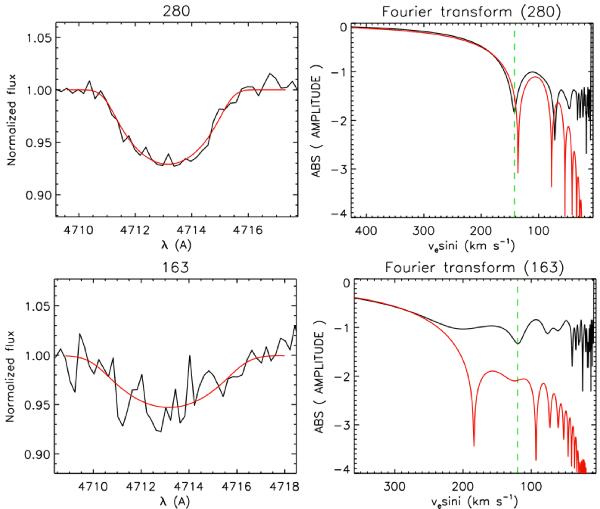
Example of the GOF and FT measurement methods applied to the He iλ4713 line of VFTS 280 (top row, high S/N) and VFTS 163 (bottom row, poor S/N), to illustrate two different data qualities. Left-hand column: line profile (black) and its GOF solution (red). Right-hand column: Fourier transform of the observed spectrum (black) and of the best fit GOF profile (red). The dashed lines indicate the position of the FT first minimum.
Current usage metrics show cumulative count of Article Views (full-text article views including HTML views, PDF and ePub downloads, according to the available data) and Abstracts Views on Vision4Press platform.
Data correspond to usage on the plateform after 2015. The current usage metrics is available 48-96 hours after online publication and is updated daily on week days.
Initial download of the metrics may take a while.