Fig. 6
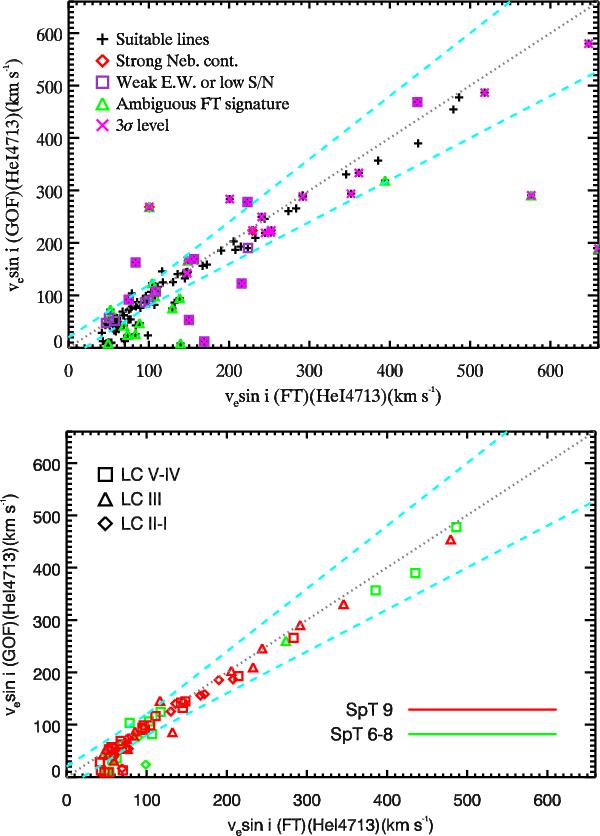
Comparison of νesini values obtained from the FT and GOF methods for He iλ4713. Upper panel: different symbols indicate different data qualities, identified in the legend. Lower panel: same as above after discarding the lower quality data. Information on the LC and SpT of the targets is provided by the symbol shapes and colors (see legend). In both panels, the dotted lines indicates the 1:1 relation. The dashed lines show the ± 20 kms-1 or ± 20%, whichever is the largest, around the 1:1 relation.
Current usage metrics show cumulative count of Article Views (full-text article views including HTML views, PDF and ePub downloads, according to the available data) and Abstracts Views on Vision4Press platform.
Data correspond to usage on the plateform after 2015. The current usage metrics is available 48-96 hours after online publication and is updated daily on week days.
Initial download of the metrics may take a while.