Fig. 1
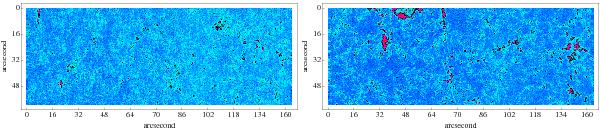
Polarization images in the FeI 630.15 nm line. The 1024-pixel spectrograph slit was orientated along the north-south solar axis and scanned 380 positions along the east-west direction. Left panel: southern solar limb, right panel: solar disk center. The colors are coded according to the logarithm of the total polarization normalized by its mean value over the image. Color code: the mean polarization in the image is coded in black. The logarithmic polarization range in each image is divided into four intervals indicated by four colors, red: [Mean + (Max − Mean)/2;Max], magenta: [Mean;Mean + (Max − Mean)/2], cyan: [Mean − (Mean − Min)/2;Mean], blue: [Min;Mean − (Mean − Min)/2]. Max and Min denote, respectively, the maximum and minimum of the normalized polarization in the image on a logarithmic scale. At the limb, Max/Mean = 17.01 and Min/Mean = 0.52; at disk center Max/Mean = 24.32 and Min/Mean = 0.44.
Current usage metrics show cumulative count of Article Views (full-text article views including HTML views, PDF and ePub downloads, according to the available data) and Abstracts Views on Vision4Press platform.
Data correspond to usage on the plateform after 2015. The current usage metrics is available 48-96 hours after online publication and is updated daily on week days.
Initial download of the metrics may take a while.