Fig. 11
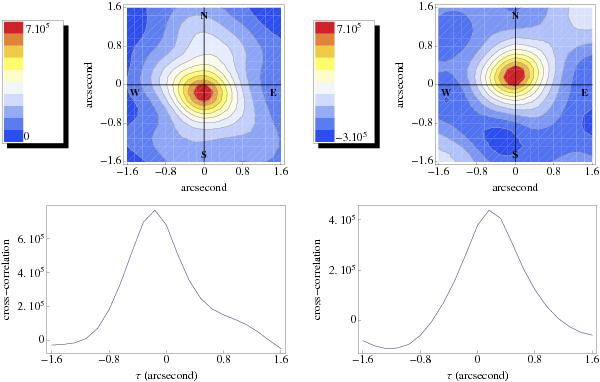
Comparison of total polarization with reversed granulation images. Upper-left panel: cross-correlation of FeI 630.15 nm polarization image with the reversed granulation at μ = 0.66 (sinθ = 0.75) in the northern hemisphere. Upper-right panel: cross-correlation of FeI 630.15 nm polarization image with the reversed granulation at μ = 0.66 in the southern hemisphere. Lower-left panel: north-south cut along the polar axis of the 2D cross-correlation shown in the upper-left panel. Lower-right panel: north-south cut along the polar axis of the 2D cross-correlation shown in the upper-right panel.
Current usage metrics show cumulative count of Article Views (full-text article views including HTML views, PDF and ePub downloads, according to the available data) and Abstracts Views on Vision4Press platform.
Data correspond to usage on the plateform after 2015. The current usage metrics is available 48-96 hours after online publication and is updated daily on week days.
Initial download of the metrics may take a while.