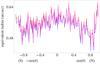
Fig. 5

Left-hand panel: radius of the correlation peak of the granulation seen in the continuum (pink curve), and in the wings of the FeI 630.15 nm (blue curve) and FeI 630.25 nm lines (red curve), as functions of the image position. For images in the southern hemisphere we use − sinθ as the coordinate, whereas in the northern hemisphere we use sinθ (θ is the heliocentric angle). Right-hand panel: same as the left-hand panel but for the correlation peaks of the polarization images.

Current usage metrics show cumulative count of Article Views (full-text article views including HTML views, PDF and ePub downloads, according to the available data) and Abstracts Views on Vision4Press platform.
Data correspond to usage on the plateform after 2015. The current usage metrics is available 48-96 hours after online publication and is updated daily on week days.
Initial download of the metrics may take a while.