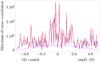
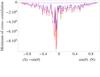
Fig. 7
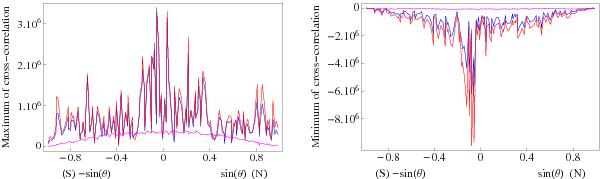
Left panel: value of the maximum of granulation and polarization cross-correlation. Blue curve: polarization in the FeI 630.15 nm line, red curve: polarization in the FeI 630.25 nm line, pink curve: positive peak in the cross-correlation of granulation with continuum polarization. Right panel: value of the minimum of the cross-correlation; the curves have the same meaning as in the left-hand panel. The horizontal axis gives the value of − sinθ for images in the southern hemisphere and of sinθ for images in the northern hemisphere, where θ is the heliocentric angle.
Current usage metrics show cumulative count of Article Views (full-text article views including HTML views, PDF and ePub downloads, according to the available data) and Abstracts Views on Vision4Press platform.
Data correspond to usage on the plateform after 2015. The current usage metrics is available 48-96 hours after online publication and is updated daily on week days.
Initial download of the metrics may take a while.