Fig. 3
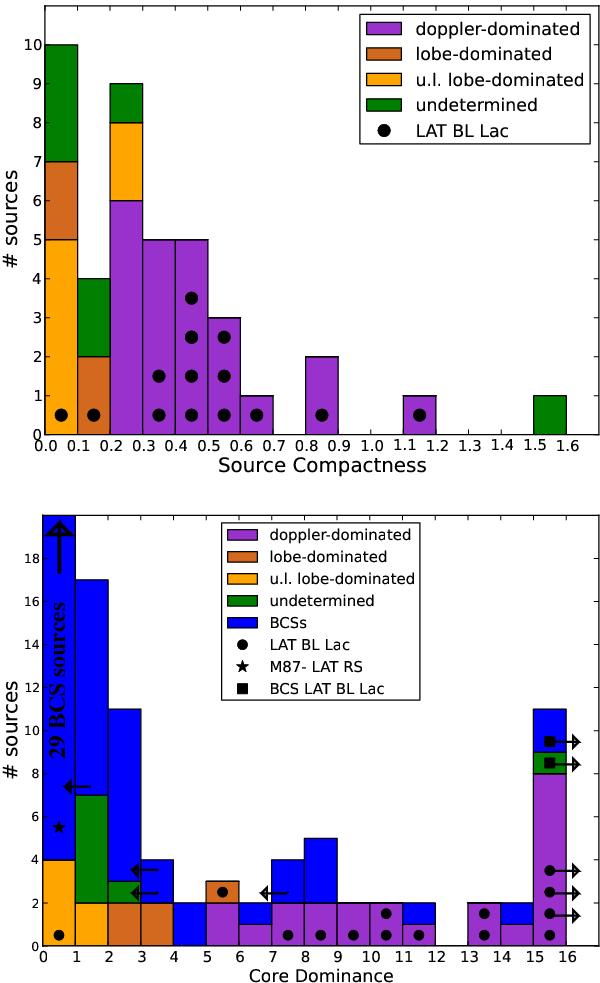
Source compactness (SC, top panel) and core dominance (CD, bottom panel) distributions for the present sample of BL Lacs using the classification given in Sect. 4.3. U.L. indicates that the corresponding values are upper limits. Gamma-ray BL Lacs are reported with black dots. In the CD histogram, we plot sources (all radio galaxies, but 2 BL Lacs) of the Bologna Complete Sample (Liuzzo et al. 2009). Two different symbols are used to represent the three gamma-ray BCS sources: M 87 (star) and 2 BL Lacs (square). Arrows indicate upper- and lower-limit CD values.
Current usage metrics show cumulative count of Article Views (full-text article views including HTML views, PDF and ePub downloads, according to the available data) and Abstracts Views on Vision4Press platform.
Data correspond to usage on the plateform after 2015. The current usage metrics is available 48-96 hours after online publication and is updated daily on week days.
Initial download of the metrics may take a while.