Fig. 2
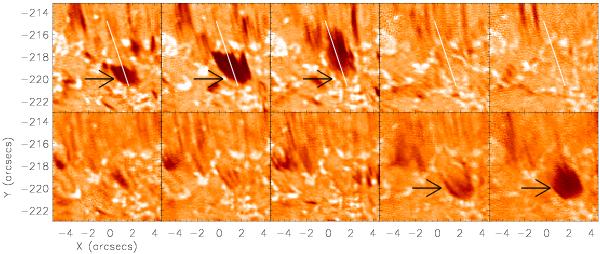
Temporal evolution in the blue and red wings of the Hα line profile. (Top row) Evolution of this event through time (from 17:29:42 UT to 17:35:35 UT) in the blue wing (each frame is separated by approximately 70 s). (Bottom row) Corresponding FOV and frames in the red wing showing the apparent parabolic trajectory of this event. The white line indicates an artificial slit used to enable a time-distance plot (shown in Fig. 3).
Current usage metrics show cumulative count of Article Views (full-text article views including HTML views, PDF and ePub downloads, according to the available data) and Abstracts Views on Vision4Press platform.
Data correspond to usage on the plateform after 2015. The current usage metrics is available 48-96 hours after online publication and is updated daily on week days.
Initial download of the metrics may take a while.