Fig. 4
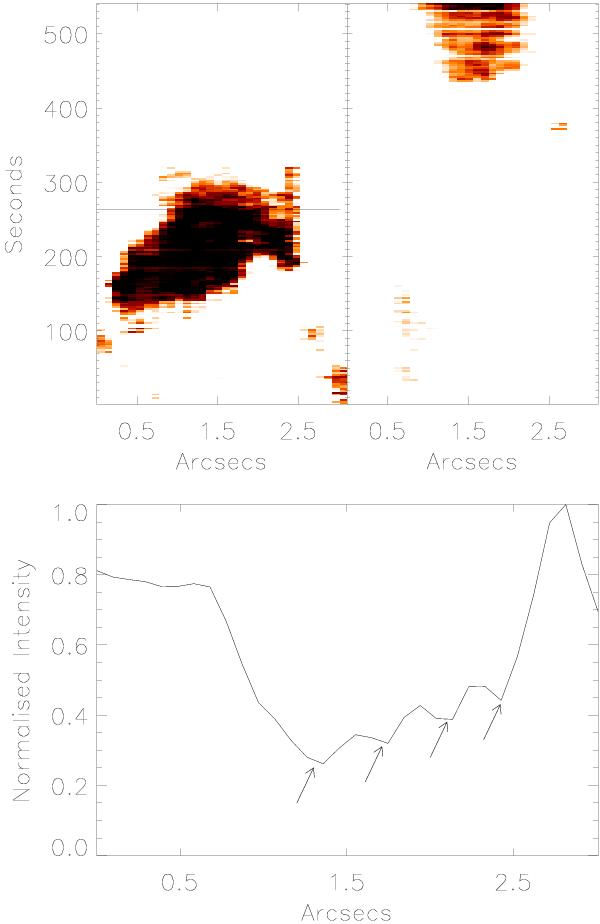
Emission of the Hα line wings for a slit perpendicular to the event, highlighting the small-scale structuring within the events. (Top row) Time-distance plots taken for a slit across the event in the blue wing (left) and red wing (right). We emphasize the threads in this plot by enhancing the contrasts of the image. A black slit is over-plotted to indicate the region plotted with respect to intensity (bottom row). Note, the quadruple intensity minima between 1′′ and 2.5′′ indicated by the arrows.
Current usage metrics show cumulative count of Article Views (full-text article views including HTML views, PDF and ePub downloads, according to the available data) and Abstracts Views on Vision4Press platform.
Data correspond to usage on the plateform after 2015. The current usage metrics is available 48-96 hours after online publication and is updated daily on week days.
Initial download of the metrics may take a while.