Fig. 5
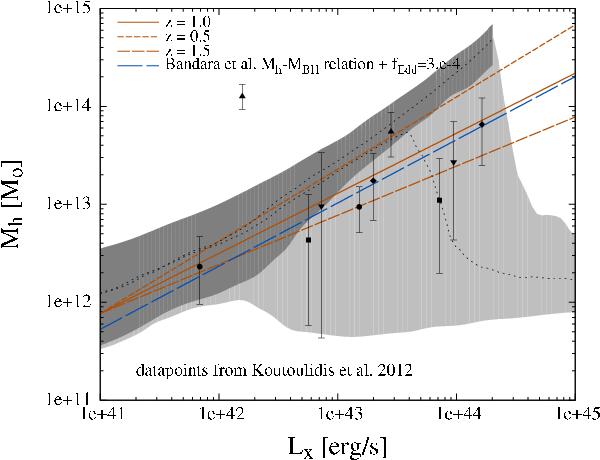
Comparison of the Mh − LX scaling relation with the observational data from Koutoulidis et al. (2012). To capture the redshift range of majority of AGN used in this analysis, we have plotted the model scaling relations for three redshifts: z = 0.5,1.0,1.5. The dotted lines with surrounding gray bands display the results from the semianalytic galaxy–AGN co-evolution model of Fanidakis et al. (2012), as presented in Koutoulidis et al. (2012), showing their “hot-halo” (dark gray region) and “all AGN” case, i.e., the sum of “hot-halo” and “starburst” modes (light gray region). The long-dashed line shows the Mh − LX scaling one obtains once converting the amplitude-adjusted Mh − MBH relation of Bandara et al. (2009) by using the fixed Eddington ratio fEdd ≡ LX/LEdd(MBH) = 3 × 10⁻⁴.
Current usage metrics show cumulative count of Article Views (full-text article views including HTML views, PDF and ePub downloads, according to the available data) and Abstracts Views on Vision4Press platform.
Data correspond to usage on the plateform after 2015. The current usage metrics is available 48-96 hours after online publication and is updated daily on week days.
Initial download of the metrics may take a while.