Fig. B.1
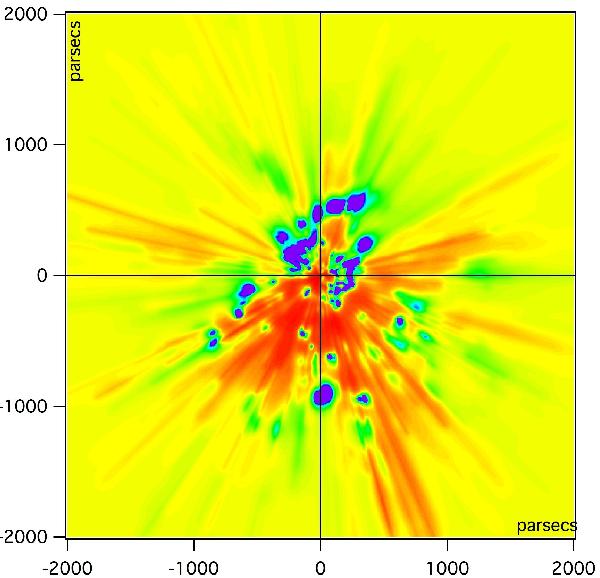
Galactic plane cut in the 4000 pc 3D distribution of inverted opacity. This map clearly shows the limits between the prior distribution (homogeneous color) and areas where the model has been constrained by the dataset. The elongated radial structures correspond to directions where cavities over dense areas are detected but the number of target stars is too small to constrain their location, hence the spread over a large distance.
Current usage metrics show cumulative count of Article Views (full-text article views including HTML views, PDF and ePub downloads, according to the available data) and Abstracts Views on Vision4Press platform.
Data correspond to usage on the plateform after 2015. The current usage metrics is available 48-96 hours after online publication and is updated daily on week days.
Initial download of the metrics may take a while.