Fig. 9
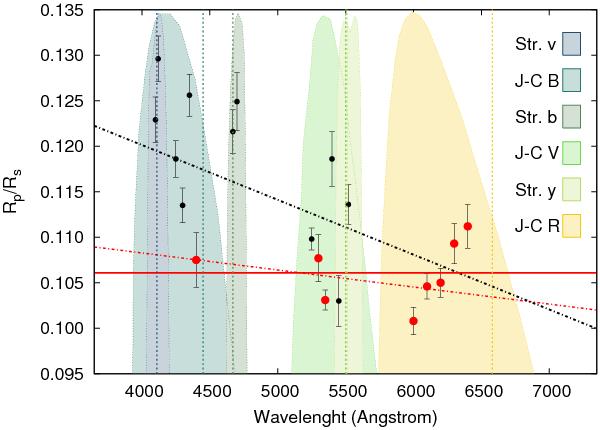
Planet-to-star ratio  obtained from complete light curves (red points) and incomplete ones (black
points) when the pulsations have been accounted for in the model fitting. Vertical
color-dashed lines indicate the central wavelength of each filter. The
dashed/dotted black line shows the best-fitting linear model to the 19
Rp/Rs
data points. In red and considering complete primary transits only, the
dashed/dotted line shows the low-significant wavelength-dependent trend, while the
continuous line accounts for the mean radius ratio.
obtained from complete light curves (red points) and incomplete ones (black
points) when the pulsations have been accounted for in the model fitting. Vertical
color-dashed lines indicate the central wavelength of each filter. The
dashed/dotted black line shows the best-fitting linear model to the 19
Rp/Rs
data points. In red and considering complete primary transits only, the
dashed/dotted line shows the low-significant wavelength-dependent trend, while the
continuous line accounts for the mean radius ratio.
Current usage metrics show cumulative count of Article Views (full-text article views including HTML views, PDF and ePub downloads, according to the available data) and Abstracts Views on Vision4Press platform.
Data correspond to usage on the plateform after 2015. The current usage metrics is available 48-96 hours after online publication and is updated daily on week days.
Initial download of the metrics may take a while.