Fig. 1
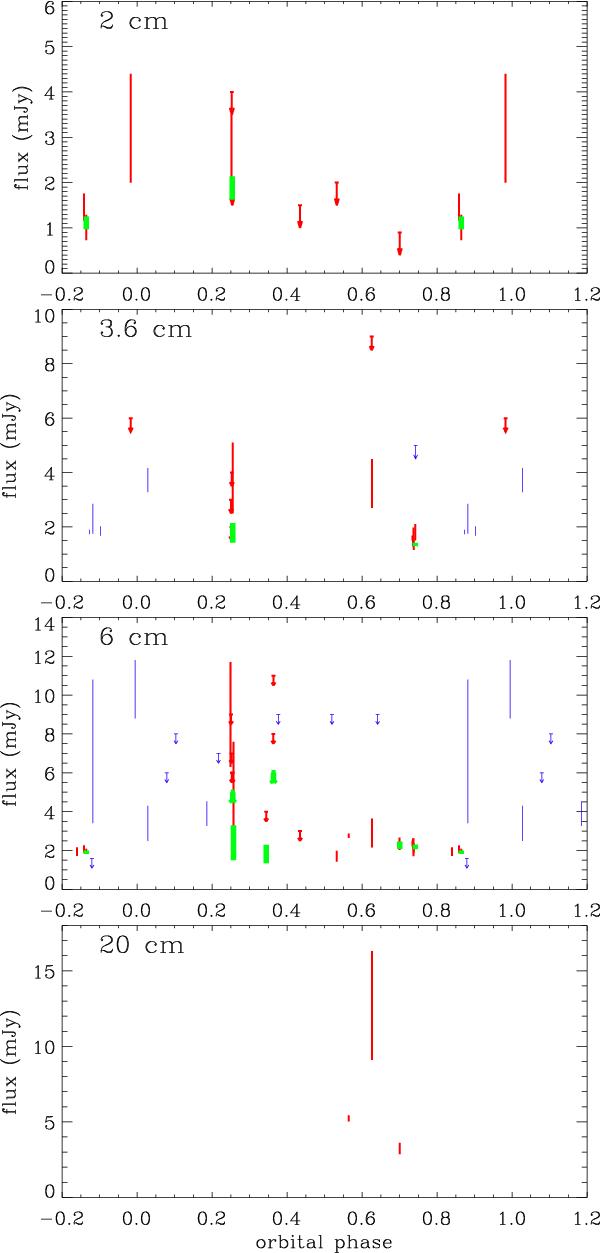
9 Sgr radio fluxes as a function of orbital phase in the 9.1 year period. The detections are shown with their error bars, the upper limits as arrows. Red data points are observations that are centred on 9 Sgr; blue data points have 9 Sgr off-centre. The green bars indicate data that have been combined. Phase 0.0 corresponds to periastron passage.
Current usage metrics show cumulative count of Article Views (full-text article views including HTML views, PDF and ePub downloads, according to the available data) and Abstracts Views on Vision4Press platform.
Data correspond to usage on the plateform after 2015. The current usage metrics is available 48-96 hours after online publication and is updated daily on week days.
Initial download of the metrics may take a while.