Fig. 3
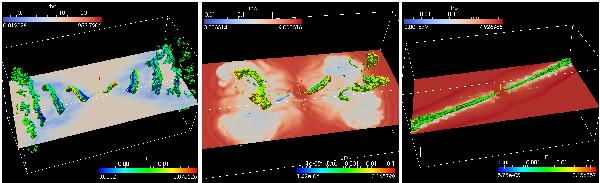
Global view of three cases at times t = 2 (6.53 years) for cases A and B and time t = 0.25 (0.82 year) for case D. Density is shown on a 2D cut. The jet beam is drawn with the jet filter from Sect. 2.4. The pressure is quantified on the jet beam surface. Left: case A γ = 1.036; middle: case B γ = 1.87; right: case D γ = 1.87, no precession.
Current usage metrics show cumulative count of Article Views (full-text article views including HTML views, PDF and ePub downloads, according to the available data) and Abstracts Views on Vision4Press platform.
Data correspond to usage on the plateform after 2015. The current usage metrics is available 48-96 hours after online publication and is updated daily on week days.
Initial download of the metrics may take a while.