Fig. 2
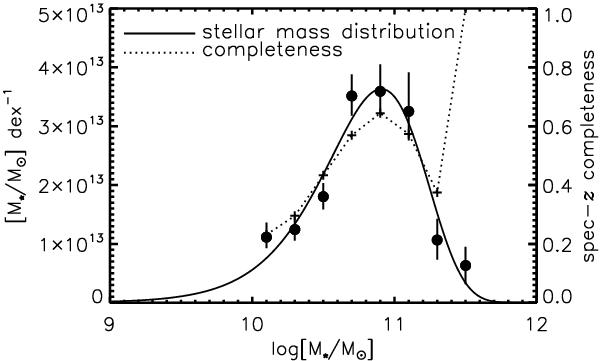
Solid line: distribution of total stellar mass contained in galaxies with a given stellar mass. The points with error bars are the measurements of the SMF presented in van der Burg et al. (2013), but integrated over the mass bins. Dotted line: spectroscopic completeness for galaxies with projected distances from the BCG less than R200. For the galaxies that constitute most of the stellar mass in the clusters, the spectroscopic completeness is high (≳50%).
Current usage metrics show cumulative count of Article Views (full-text article views including HTML views, PDF and ePub downloads, according to the available data) and Abstracts Views on Vision4Press platform.
Data correspond to usage on the plateform after 2015. The current usage metrics is available 48-96 hours after online publication and is updated daily on week days.
Initial download of the metrics may take a while.